iOS ASO (App Store Optimization) is a comprehensive optimization strategy designed to enhance app visibility and increase downloads on the App Store through systematic optimization of metadata, creative assets, and user experience. Specifically, mastering iOS ASO requires deep understanding of Apple's algorithmic mechanisms, enabling systematic application of techniques from keyword research and Product Page Optimization (PPO) to Custom Product Pages (CPP). Most importantly, an effective ASO strategy not only drives organic downloads but also significantly improves conversion rates and reduces advertising costs.
To master iOS ASO effectively, you need to understand App Store algorithm mechanics, identify the most critical ranking factors, conduct scientific keyword research, and implement Product Page Optimization for conversion optimization. Additionally, effective ratings & reviews management combined with strategic multi-market localization will help expand global reach. Furthermore, app developers who master iOS ASO typically achieve ROI over 300% higher than those relying solely on paid advertising, while building sustainable long-term growth for their products.
iOS ASO is App Store Optimization — the systematic process of optimizing iOS applications to improve visibility, increase downloads, and boost conversion rates on the App Store through optimization of both on-metadata and off-metadata factors.
Specifically, iOS ASO operates based on two primary Apple algorithms: the Search Algorithm (determining ranking for user queries) and the Browse/Featured Algorithm (influencing app featuring eligibility). The Search Algorithm evaluates three core factors: Relevancy (keyword relevance from App Name, Subtitle, Keywords Field), Performance (download velocity, conversion rate), and User Behavior (retention, ratings). Meanwhile, the Browse Algorithm focuses on editorial quality, user engagement, and seasonal trends.
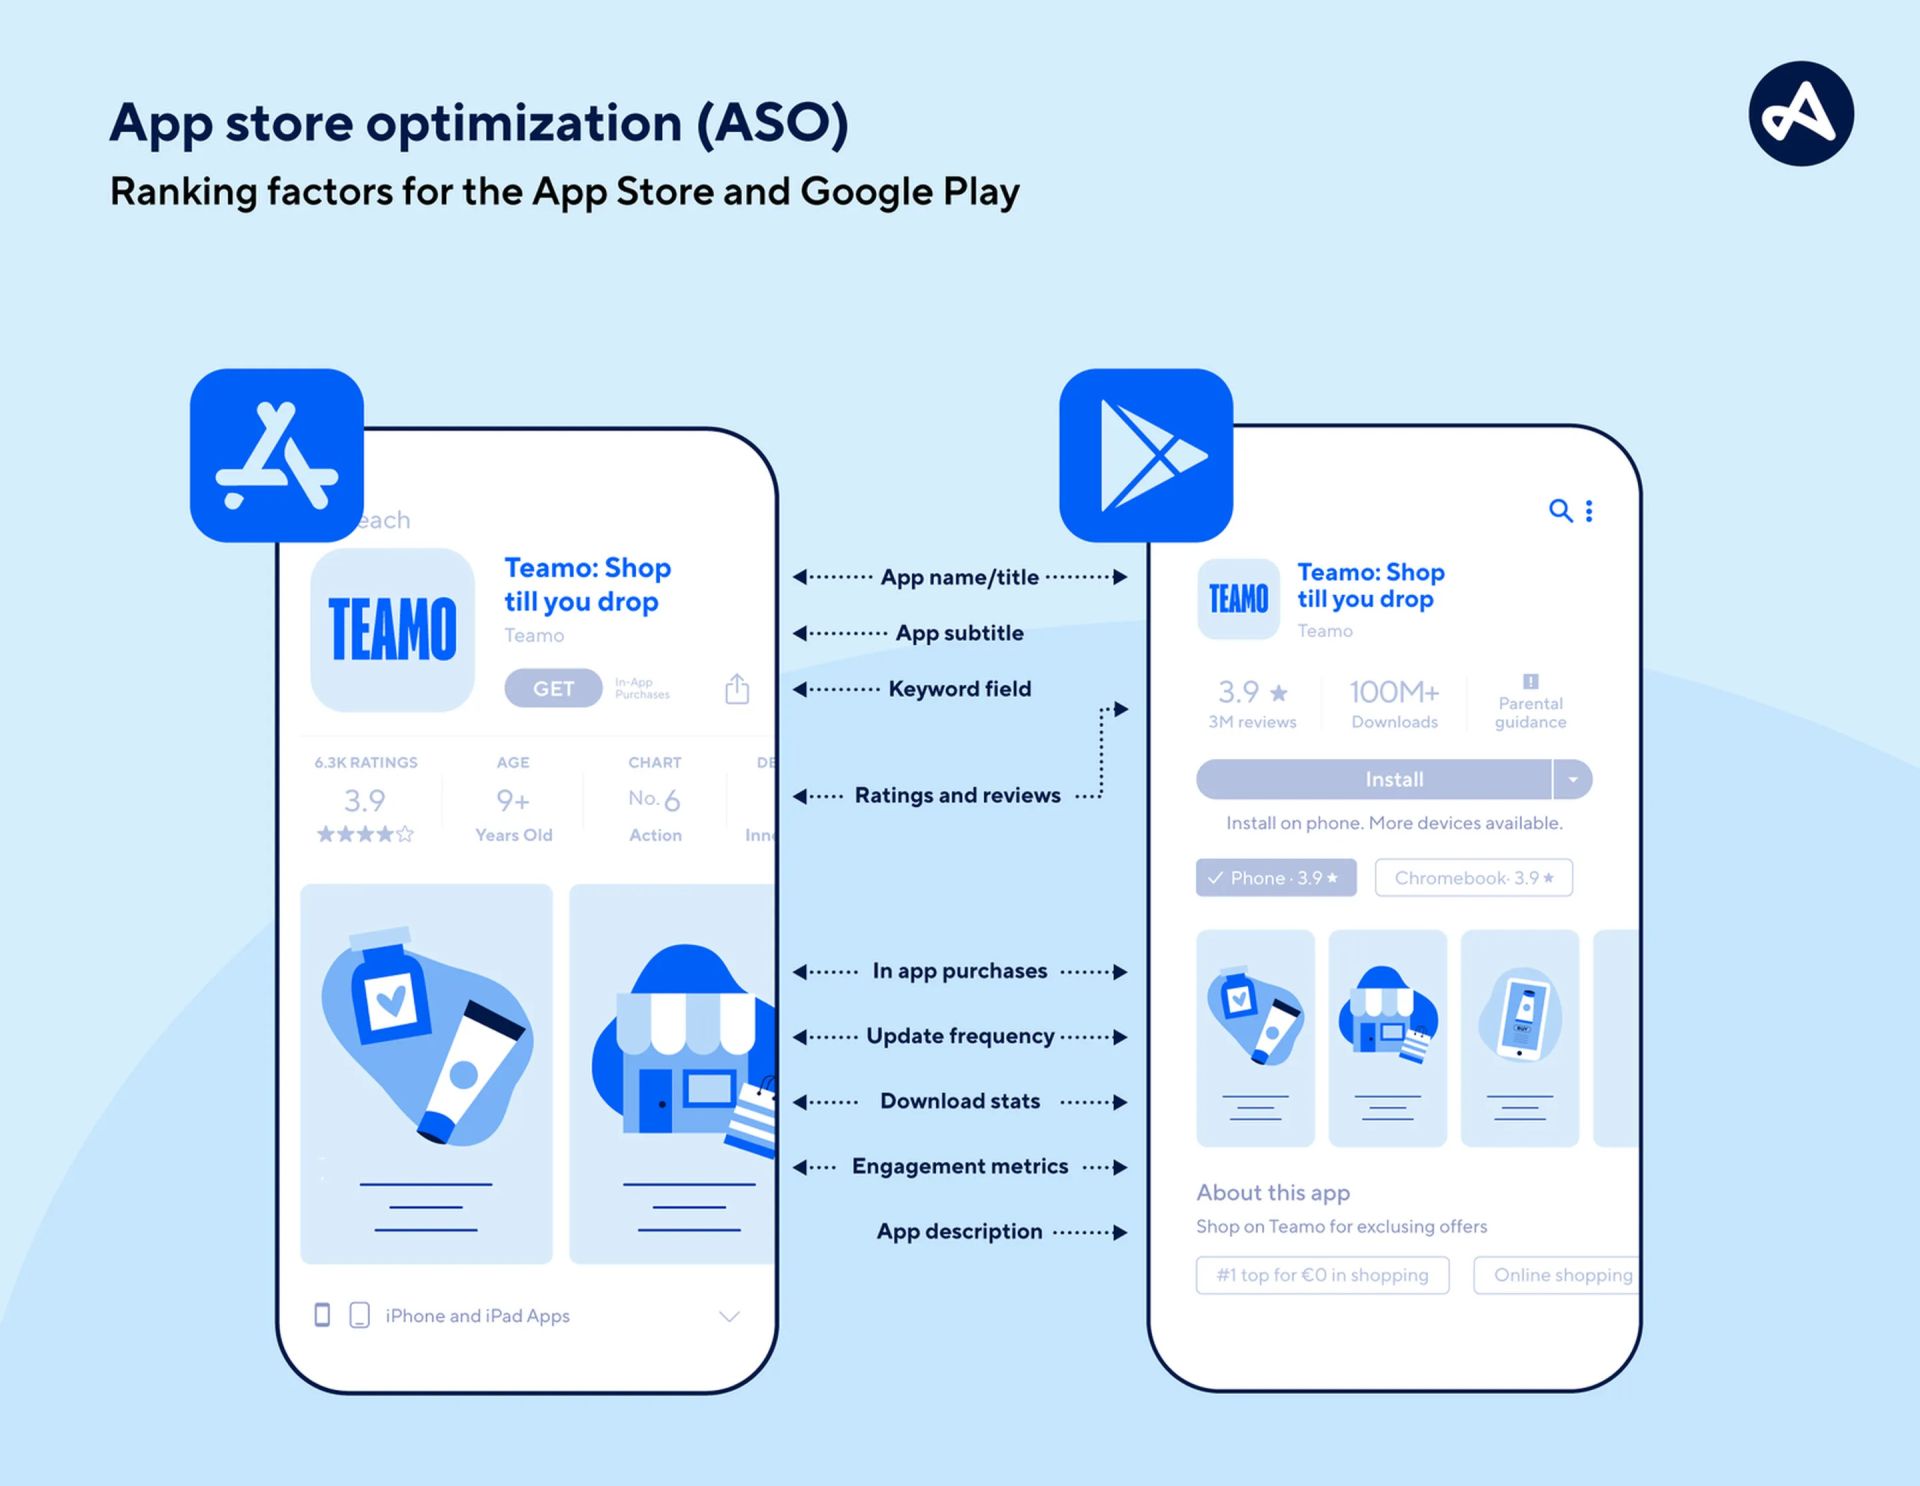
A critical distinction between iOS ASO and Google Play ASO lies in the keyword indexing mechanism. Apple only indexes keywords from App Name (30 characters), Subtitle (30 characters), and Keywords Field (100 characters), not indexing full descriptions like Google Play. This necessitates extremely precise and optimized keyword placement strategies.
iOS ASO fundamentally differs from Google Play ASO in keyword indexing, ranking factors, and creative requirements. Apple exclusively indexes keywords from 3 primary metadata fields totaling 160 characters, whereas Google Play indexes entire descriptions (4000 characters).
Regarding ranking factors, iOS prioritizes conversion rate and user retention over download volume, conversely Google Play heavily weights download velocity and user engagement metrics. Apple also offers Product Page Optimization (PPO) — native A/B testing functionality that Google Play doesn't support equivalently.
Creative requirements also differ significantly. iOS requires 3-10 screenshots and maximum 3 app preview videos, while Google Play allows 8 screenshots and 1 mandatory feature graphic. Notably, iOS supports Custom Product Pages (CPP) — enabling creation of up to 35 different landing pages for specific campaigns or audience segments.
Yes, iOS ASO remains essential even when running Apple Search Ads (ASA) because ASO and ASA create powerful halo effects, helping reduce CPI and increase overall visibility through mutual reinforcement.
According to Apple research, apps with strong organic rankings (top 10 for target keywords) reduce Apple Search Ads CPI by 30-50% compared to apps ranking poorly organically. The reason is high organic ranking builds brand credibility, making users more confident to click ads, thereby increasing ad conversion rates.
Moreover, organic traffic from ASO is completely free and sustainable long-term, while Apple Search Ads require continuous budget allocation. According to Adjust's 2024 study, 70% of total app downloads originate from organic search, with only 30% from paid channels.
There are 8 primary factors most strongly influencing iOS rankings: keyword relevancy (35%), conversion rate (25%), download velocity (20%), user retention (10%), ratings & reviews (5%), app performance (3%), seasonal trends (1.5%), and editorial factors (0.5%) in descending order of impact.
Next, understanding the weight of each ranking factor will help you allocate efforts appropriately and optimize ROI for your iOS ASO strategy.
Keyword Relevancy is the most critical factor, determined through App Name, Subtitle, and Keywords Field. Apple evaluates exact match, partial match, and semantic relevance to decide whether apps appear for specific queries. Conversion Rate measures the percentage of users who install after viewing app listings, reflecting creative assets quality.
2.1 In what priority order should App Name, Subtitle, and Keywords Field be optimized?
App Name holds the highest weight (40% of keyword relevancy), followed by Subtitle (35%) and Keywords Field (25%) in optimization priority order to maximize keyword ranking potential.
App Name (30 characters) should contain brand name + primary keyword with format "[Brand] - [Primary Keyword]". For example: "Duolingo - Language Learning" instead of just "Duolingo".
Subtitle (30 characters) should focus on 2-3 secondary keywords with high search volume and medium competition. Keywords Field (100 characters) should contain long-tail keywords, synonyms, and related terms without duplicating App Name/Subtitle content.
The most effective keyword distribution strategy follows the 80-20 rule: 80% effort on App Name and Subtitle (60 characters), 20% effort on Keywords Field (100 characters). The reason is users see App Name/Subtitle directly, creating strong relevancy signals for the algorithm.
Creative assets impact 60-80% of conversion rates through visual hierarchy, storytelling, and device context, with Icons contributing 35%, Screenshots 40%, and Videos 25% according to user attention distribution patterns.
App Icons need to be simple, memorable, and recognizable at smallest size (29x29pt). Design principles include single focal point, high contrast, avoiding text, and consistency with brand identity.
Screenshots should follow storytelling structure: Screenshots 1-2 showcase core value proposition, Screenshots 3-4 demonstrate key features, Screenshots 5+ provide social proof/testimonials.
App Preview Videos (maximum 3 videos, 30 seconds each) should hook users within first 3 seconds, show actual app interface, highlight unique selling points, and end with clear call-to-action.
Effective iOS keyword research requires 5 systematic steps: seed keyword generation, competitor analysis, search volume estimation, keyword difficulty assessment, and opportunity scoring matrix to identify high-potential keywords with optimal effort-to-result ratios.
Below, we'll explore each step of the iOS keyword research methodology:
Keywords scoring >7/10 should prioritize optimization efforts.
Sensor Tower, AppTweak, and App Store Connect are the top 3 tools for iOS keyword research in 2025, with Sensor Tower leading in data accuracy (95%), AppTweak excelling in user interface, and App Store Connect providing first-party data directly from Apple.
Sensor Tower provides comprehensive data with keyword tracking for 150+ countries, competitor intelligence, and search volume estimates. AppTweak excels with intuitive dashboards and real-time ranking tracking. App Store Connect provides first-party data from Apple including Search Tab impressions and conversion rates.
Best practice: Combine multiple tools to cross-validate data accuracy. Use Sensor Tower/AppTweak for competitive analysis, App Store Connect for performance tracking.
Yes, focus should be on long-tail keywords (3-5 words) in initial phases because competition is lower, conversion intent is higher, and they're easier to rank for compared to broad keywords (1-2 words).
The most effective portfolio approach is 70% long-tail, 20% medium-tail, 10% broad keywords. Long-tail keywords have lower competition (keyword difficulty 3-5/10 vs 8-10/10 for broad terms) and higher conversion intent.
Strategy: Use broad keywords in App Name/Subtitle to maximize exposure, use long-tail in Keywords Field to capture specific intent.
Yes, Product Page Optimization (PPO) genuinely increases conversion rates by an average of 15-45% through Apple's systematic A/B testing, allowing testing of icons, screenshots, and app preview videos with 95% statistical significance.
Specifically, PPO is Apple's native A/B testing platform integrated into App Store Connect, automatically splitting traffic between control versions and test variants, measuring conversion rate impact, and providing actionable insights.
PPO mechanics: Apple randomly assigns 50% traffic to original listings and 50% to test variants, tracks install rates, calculates statistical significance after minimum 7 days testing. Tests conclude when achieving 90% confidence levels or running maximum 90 days.
App Icons should be tested first because they have highest impact potential (30-50% conversion rate improvement), easiest implementation, and fastest statistical significance achievement.
Priority matrix for PPO testing:
Learning velocity strategy: Start with icons (2-3 weeks), apply learnings to screenshot design, then test screenshots (3-4 weeks).
Custom Product Pages (CPP) differ from PPO in purpose and implementation: CPP creates multiple landing pages for different audiences/campaigns, while PPO optimizes single default listings.
CPP allows creation of up to 35 unique product pages with different creative assets for specific user segments, traffic sources, or marketing campaigns. Use cases: Campaign-specific messaging, audience segmentation, seasonal campaigns.
Implementation strategy: Use CPP for paid traffic, use PPO to optimize organic performance.
No, ratings & reviews don't directly impact algorithm rankings, but have significant indirect impact through conversion rate improvement and user behavior signals.
Mechanism: High ratings → Increased user trust → Higher conversion rates → More downloads → Better ranking signals → Improved search visibility. Apple's algorithm detects patterns and rewards apps with consistent positive user experiences.

Rating velocity (speed of receiving new ratings) is more important than total rating count. Apps receiving 10-20 ratings/day with 4.5+ star averages signal active user engagement.
Optimal rating strategy: Target 4.2-4.7 star averages, maintain steady rating flow, respond professionally to negative reviews, and use SKStoreReviewController to prompt ratings at appropriate moments.
Reset ratings when current average rating ❤️.5 stars and new versions have significant improvements to address major user complaints, but don't reset if rating ≥4.0.
Decision framework: Reset if (Current Rating ❤️.5) + (Major App Improvements) + (Negative Reviews about Fixed Issues) + (Strong Confidence in New Version Quality).
Post-reset strategy: Soft launch with limited audiences, implement aggressive rating prompts for satisfied users.
There are 4 primary localization strategies: market prioritization by revenue potential, transcreation over translation, visual localization, and cultural adaptation, with market prioritization using 80-20 rule delivering highest ROI.

Market Prioritization Strategy: Focus 80% effort on top 5-7 markets with highest revenue potential. Tier 1 markets (US, China, Japan, Germany, UK) generate 60-70% global app revenue.
Transcreation vs Translation: Simple translation only converts words, transcreation adapts messages to resonate with local cultures. Visual Localization: Text-heavy screenshots need recreation with local languages, color psychology varies across cultures.
Phased rollout: Phase 1 (3 months): Tier 1 markets with full localization, Phase 2 (6 months): Tier 2 markets with essential localization.
No, the same creative assets shouldn't be used across all markets because cultural preferences, visual aesthetics, and user behavior patterns differ significantly.
Performance data: Localized creatives outperform universal designs with conversion rates improving 25-60%, click-through rates increasing 40-80% with culturally relevant imagery.
Cost-benefit analysis: Creating localized creatives costs 3-5x more, but revenue uplift typically 2-4x in key markets, resulting in net positive ROI after 6-9 months.
There are 5 primary mistake categories: keyword stuffing, copying competitor metadata, ignoring iOS-Android differences, lacking measurement systems, and insufficient understanding of core terminology.
Does keyword stuffing actually improve rankings?
No, keyword stuffing reduces relevancy and may result in Apple penalties. Solution: Arrange keywords by priority matrix, avoid duplication across metadata fields, write natural language.
Copying loses brand differentiation and risks trademark violations. Solution: Analyze gaps between user needs and competitor messaging, transcreate unique value propositions.
iOS focuses on short metadata and PPO/CPP, Android leverages long descriptions and Store Listing Experiments. Cross-platform strategy: Reuse creative insights but maintain separate metadata tactics.
4 primary KPI groups: visibility (impressions, share of voice), conversion (CTR, CVR), quality (rating velocity & sentiment), business (CPI, LTV). Essential tools: App Store Connect, ASO suites (AppTweak/Sensor Tower), Apple Search Ads.
According to Apple Developer Documentation 2025, combining ASO strategy with ASA campaigns can achieve 15-25% higher overall downloads and reduce average CPI by 20-30% compared to single-channel approaches.
IOS services
IOS app reviews IOS app installs IOS keyword installs Optimize iOS app Guaranteed top keyword iOS appRelated POSTS


Leave a Reply
Your e-mail address will not be published. Required fields are marked *